Quantitation: Reporter protocol
This is quantitation based on the relative intensities of fragment peaks at fixed m/z values within an MS/MS spectrum. All of the required information contained within the peak list, so the quantitation report can be generated as part of a standard Mascot result report.
Chemistries
iTRAQtm
The first commercially available chemistry for the reporter protocol was Applied Biosystems (now AB SCIEX) iTRAQ. The original reagents provided a set of 4 isobaric tags, and an 8-plex chemistry is now available. A good overview of 4-plex iTRAQ is provided by Ross, P. L., et al., Multiplexed protein quantitation in Saccharomyces cerevisiae using amine-reactive isobaric tagging reagents, Molecular & Cellular Proteomics 3 1154-1169 (2004). The iTRAQ pages on the AB Sciex web site contain additional information.
TMT®
The reporter protocol also supports Tandem Mass Tags, as described in Thompson, A., et al., Tandem mass tags: A novel quantification strategy for comparative analysis of complex protein mixtures by MS/MS, Analytical Chemistry 75 1895-1904 (2003)
Configuration notes
The mass tolerance to be used for matching reporter ion peaks can be specified using Reporter Tolerance (reporter_tol, optional) and Reporter Tolerance Unit (reporter_tol_unit, optional). If not specified, the MS/MS tolerance and unit are used
Precursor ion selection on any TOF instrument tends to have limited resolution, which increases the chance of getting a mixed MS/MS spectrum due to interference from nearby precursor. When this happens, it is likely to make the measured ratio closer to 1. Although the quality element includes a test for whether the precursor region is clean (Fraction threshold), this cannot be used here because the reporter protocol works off the MS/MS peak list, so there is no mechanism for inspecting the survey scan. On the other hand, having a wide precursor selection window can be an advantage, because a narrow window might discriminate against under-enriched precursors. The isotope correction factors are designed to compensate for any under-enrichment, but this assumes that the transmission window is wide enough to include the under-enriched precursors, which are not isobaric with the fully enriched precursor.
iTRAQ modification of Tyr should be included as a variable modification and an exclusion element used to remove these matches from the quantitation report. This is because the reaction with Tyr is slow, and likely to be incomplete, which could lead to inaccurate ratios if these matches were included.
AB SCIEX 4000 / 5000 Series Explorer
When you submit a Mascot search from AB SCIEX 4000 / 5000 Series Explorer or GPS Explorer, the peak areas are not the same as those used by GPS Explorer for quantitation. The same is true you export a peak list using the Peaks to Mascot function. This could be an issue if you plan to perform iTRAQ quantitation outside of GPS Explorer.
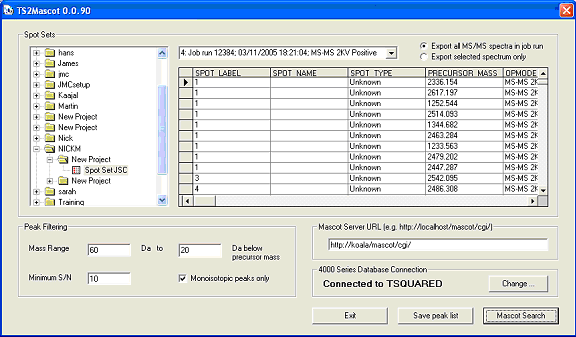
TS2Mascot is a simple, free utility to export peak lists with accurate reporter ion peak areas from an AB SCIEX 4000 / 5000 Series database. The peak list can be saved as a Mascot Generic Format (MGF) file or a Mascot search form can be invoked and the peak list submitted directly to Mascot.
TS2Mascot will run under Microsoft Windows NT 4.0 SP6, Windows 2000, Windows XP Professional, and Windows 2003 Server (32 bit only). TS2Mascot communicates with the AB SCIEX 4000 / 5000 Series database using ODBC. The PC will need to have Oracle client software installed, including the Oracle ODBC driver. To submit a Mascot search from TS2Mascot, Microsoft Internet Explorer 4.01 SP2 or later must be installed and operational.

To install TS2Mascot, run the Windows installer package. Unless 4000 Series Explorer or GPS Explorer is already installed on the target PC, you may need to create a local Oracle service name, as described in the setup instructions.
Example
Click here for an iTRAQ example of the reporter protocol. We are grateful to Phillip Humphryes and Robert Graham of the Institute of Cancer Sciences at the University of Manchester for permission to use this data, which was acquired on an ABSciex 5600.
You may notice occasional extreme or negative ratios at the peptide level. This is usually where a reporter ion peak has been missed completely in a weak spectrum. The application of the isotope purity correction then "corrects" the intensity to a negative value. It would be easy to hide such ratios, but we feel it is better to display them because a large number of instances might indicate that the peak detection settings require attention. Negative ratios, along with zero and infinity ratios, are discarded when calculating a protein ratio.
To see the quantitation method details, follow the method details link in the report header. Notice how all the modifications have been embedded into the method and an exclusion element used to remove matches with iTRAQ modification on Tyr.

